ProfilerViewer's 'skin' is provided via a combination of CSS and other style information passed via JavaScript to the Flash-based Charts Control. This example helps you understand where to start if you want to customize the look and feel of a ProfilerViewer implementation.
The Sam Skin UI for the ProfilerViewer Control:
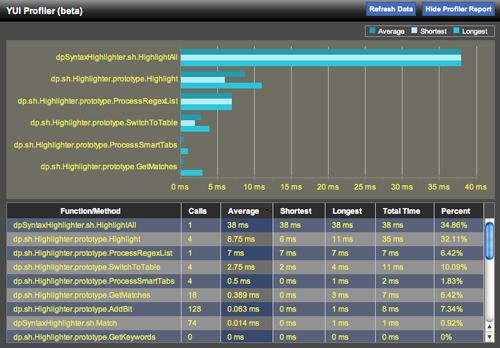
The bulk of the ProfilerViewer's UI is designated by the skin CSS file for YUI Sam Skin. That file defines:
Here is the full CSS for ProfilerViewer's YUI Sam Skin treatment. You can modify these rules or replace this file entirely in customizing ProfilerViewer.
1 | .yui-skin-sam .yui-pv { |
2 | background-color:#4a4a4a; |
3 | font:arial; |
4 | position:relative; |
5 | width:99%; |
6 | z-index:1000; |
7 | margin-bottom:1em; |
8 | overflow:hidden; |
9 | } |
10 | |
11 | .yui-skin-sam .yui-pv .hd { |
12 | background:url(header_background.png) repeat-x; |
13 | min-height:30px; |
14 | overflow:hidden; |
15 | zoom:1; |
16 | padding:2px 0; |
17 | } |
18 | |
19 | .yui-skin-sam .yui-pv .hd h4 { |
20 | padding:8px 10px; |
21 | margin:0; |
22 | font:bold 14px arial; |
23 | color:#fff; |
24 | } |
25 | |
26 | .yui-skin-sam .yui-pv .hd a { |
27 | background:#3f6bc3; |
28 | font:bold 11px arial; |
29 | color:#fff; |
30 | padding:4px; |
31 | margin:3px 10px 0 0; |
32 | border:1px solid #3f567d; |
33 | cursor:pointer; |
34 | display:block; |
35 | float:right; |
36 | } |
37 | |
38 | .yui-skin-sam .yui-pv .hd span { |
39 | display:none; |
40 | } |
41 | |
42 | .yui-skin-sam .yui-pv .hd span.yui-pv-busy { |
43 | height:18px; |
44 | width:18px; |
45 | background:url(wait.gif) no-repeat; |
46 | overflow:hidden; |
47 | display:block; |
48 | float:right; |
49 | margin:4px 10px 0 0; |
50 | } |
51 | |
52 | .yui-skin-sam .yui-pv .hd:after, |
53 | .yui-pv .bd:after, |
54 | .yui-skin-sam .yui-pv-chartlegend dl:after { |
55 | content:'.';visibility:hidden;clear:left;height:0;display:block; |
56 | } |
57 | |
58 | .yui-skin-sam .yui-pv .bd { |
59 | position:relative; |
60 | zoom:1; |
61 | overflow-x:auto; |
62 | overflow-y:hidden; |
63 | } |
64 | |
65 | .yui-skin-sam .yui-pv .yui-pv-table { |
66 | padding:0 10px; |
67 | margin:5px 0 10px 0; |
68 | } |
69 | |
70 | .yui-skin-sam .yui-pv .yui-pv-table .yui-dt-bd td { |
71 | color:#eeee5c; |
72 | font:12px arial; |
73 | } |
74 | |
75 | .yui-skin-sam .yui-pv .yui-pv-table tr.yui-dt-odd { |
76 | background:#929292; |
77 | } |
78 | |
79 | .yui-skin-sam .yui-pv .yui-pv-table tr.yui-dt-even { |
80 | background:#58637a; |
81 | } |
82 | |
83 | .yui-skin-sam .yui-pv .yui-pv-table tr.yui-dt-even td.yui-dt-asc, |
84 | .yui-skin-sam .yui-pv .yui-pv-table tr.yui-dt-even td.yui-dt-desc { |
85 | background:#384970; |
86 | } |
87 | |
88 | .yui-skin-sam .yui-pv .yui-pv-table tr.yui-dt-odd td.yui-dt-asc, |
89 | .yui-skin-sam .yui-pv .yui-pv-table tr.yui-dt-odd td.yui-dt-desc { |
90 | background:#6F6E6E; |
91 | } |
92 | |
93 | .yui-skin-sam .yui-pv .yui-pv-table .yui-dt-hd th { |
94 | background-image:none; |
95 | background:#2E2D2D; |
96 | } |
97 | |
98 | .yui-skin-sam .yui-pv th.yui-dt-asc .yui-dt-liner { |
99 | background:transparent url(asc.gif) no-repeat scroll right center; |
100 | } |
101 | |
102 | .yui-skin-sam .yui-pv th.yui-dt-desc .yui-dt-liner { |
103 | background:transparent url(desc.gif) no-repeat scroll right center; |
104 | } |
105 | |
106 | .yui-skin-sam .yui-pv .yui-pv-table .yui-dt-hd th a { |
107 | color:#fff; |
108 | font:bold 12px arial; |
109 | } |
110 | |
111 | .yui-skin-sam .yui-pv .yui-pv-table .yui-dt-hd th.yui-dt-asc, |
112 | .yui-skin-sam .yui-pv .yui-pv-table .yui-dt-hd th.yui-dt-desc { |
113 | background:#333; |
114 | } |
115 | |
116 | .yui-skin-sam .yui-pv-chartcontainer { |
117 | padding:0 10px; |
118 | } |
119 | |
120 | .yui-skin-sam .yui-pv-chart { |
121 | height:250px; |
122 | clear:right; |
123 | margin:5px 0 0 0; |
124 | color:#fff; |
125 | } |
126 | |
127 | .yui-skin-sam .yui-pv-chartlegend div { |
128 | float:right; |
129 | margin:0 0 0 10px; |
130 | _width:250px; |
131 | } |
132 | |
133 | .yui-skin-sam .yui-pv-chartlegend dl { |
134 | border:1px solid #999; |
135 | padding:.2em 0 .2em .5em; |
136 | zoom:1; |
137 | margin:5px 0; |
138 | } |
139 | |
140 | .yui-skin-sam .yui-pv-chartlegend dt { |
141 | float:left; |
142 | display:block; |
143 | height:.7em; |
144 | width:.7em; |
145 | padding:0; |
146 | } |
147 | |
148 | .yui-skin-sam .yui-pv-chartlegend dd { |
149 | float:left; |
150 | display:block; |
151 | color:#fff; |
152 | margin:0 1em 0 .5em; |
153 | padding:0; |
154 | font:11px arial; |
155 | } |
156 | |
157 | .yui-skin-sam .yui-pv-minimized {height:35px;} |
158 | |
159 | .yui-skin-sam .yui-pv-minimized .bd {top:-3000px;} |
160 | |
161 | .yui-skin-sam .yui-pv-minimized .hd a.yui-pv-refresh {display:none;} |
view plain | print | ? |
The other source of style information is that which controls the YUI Charts visualization. The chart is styled globally with the chartStyle
attribute of ProfilerViewer. The default chartStyle
definition is as follows:
1 | { |
2 | font: |
3 | { |
4 | name: "Arial", |
5 | color: 0xeeee5c, |
6 | size: 12 |
7 | }, |
8 | background: |
9 | { |
10 | color: "6e6e63" |
11 | } |
12 | } |
view plain | print | ? |
The series definitions of the chart are styled via the chartSeriesDefinitions
attribute. The default value for that attribute is as follows:
1 | { |
2 | total: { |
3 | displayName: PV.STRINGS.colHeads.total[0], |
4 | xField: "total", |
5 | style: {color:"CC3333", size:21}, |
6 | group: ["total"] |
7 | }, |
8 | calls: { |
9 | displayName: PV.STRINGS.colHeads.calls[0], |
10 | xField: "calls", |
11 | style: {color:"A658BD", size:21}, |
12 | group: ["calls"] |
13 | }, |
14 | avg: { |
15 | displayName: PV.STRINGS.colHeads.avg[0], |
16 | xField: "avg", |
17 | style: {color:"209daf", size:9}, |
18 | group: ["avg", "min", "max"] |
19 | }, |
20 | min: { |
21 | displayName: PV.STRINGS.colHeads.min[0], |
22 | xField: "min", |
23 | style: {color:"b6ecf4", size:9}, |
24 | group: ["avg", "min", "max"] |
25 | }, |
26 | max: { |
27 | displayName: PV.STRINGS.colHeads.max[0], |
28 | xField: "max", |
29 | style: {color:"29c7de", size:9}, |
30 | group: ["avg", "min", "max"] |
31 | }, |
32 | pct: { |
33 | displayName: PV.STRINGS.colHeads.pct[0], |
34 | xField: "pct", |
35 | style: {color:"bdb327", size:21}, |
36 | group: ["pct"] |
37 | } |
38 | } |
view plain | print | ? |
To fully skin the chart, you would want to modify these style objects and pass them as custom attributes when you instantiate your ProfilerViewer console. For example, to change the background color of the chart component to full black, you would do the following:
1 | var pv = new YAHOO.widget.ProfilerViewer("", { |
2 | //pass in a modified chartStyle object with your |
3 | //desired customizations: |
4 | chartStyle = { |
5 | font: |
6 | { |
7 | name: "Arial", |
8 | color: 0xeeee5c, |
9 | size: 12 |
10 | }, |
11 | background: |
12 | { |
13 | //change the background to black: |
14 | color: "000000" |
15 | } |
16 | } |
17 | }); |
view plain | print | ? |
Copyright © 2008 Yahoo! Inc. All rights reserved.
Privacy Policy - Terms of Service - Copyright Policy - Job Openings